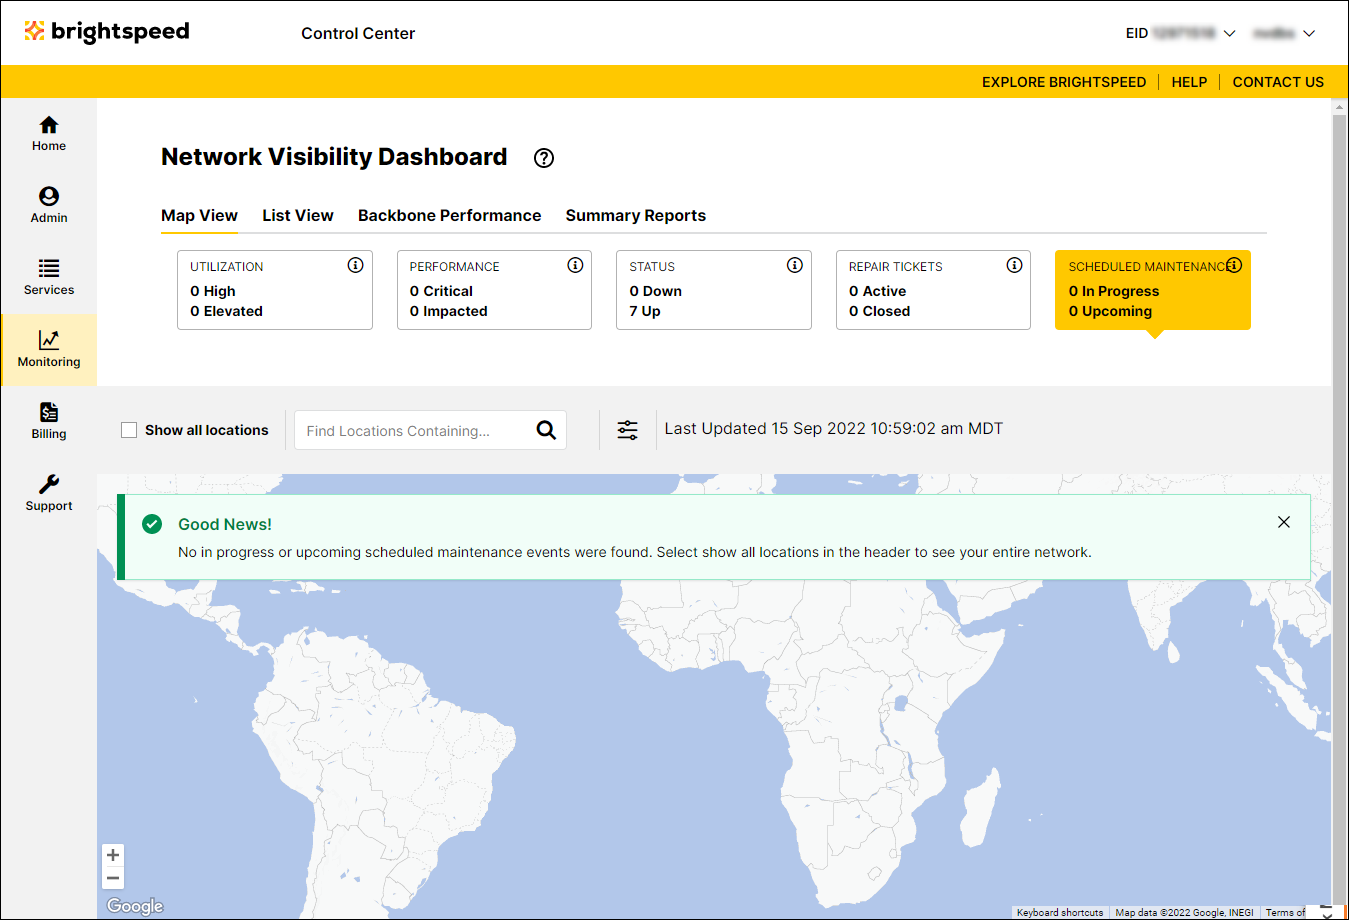
Exploring the Network Visibility dashboard

Use Network Visibility to monitor or review performance of your Brightspeed services. To quickly find a location or service, start typing it in the search field.

  • Identify problem locations or services quickly, then view details of its service utilization or performance.
  • View service utilization or performance data at a glance using Map View or List View.
  • Set threshold alerts for utilization and performance metrics to be notified if your services exceed the threshold.
  • View open repair tickets and scheduled maintenance information by location and by service.
  • View trend analysis of utilization patterns to plan for circuit upgrades, configuration changes, and scaling.
Network Visibility (showing Utilization tab)

  1. Click Monitoring, then click Network Visibility.

    Control Center opens the Network Visibility dashboard. On the map, Control Center shows locations with services needing your attention. Tiles show services with high utilization or critical issues, services that are down or have threshold warnings, as well as open tickets and scheduled maintenance for your services. Use the Map View and List View tabs above the tiles to toggle between views.
Network Visibility (showing Utilization tile)

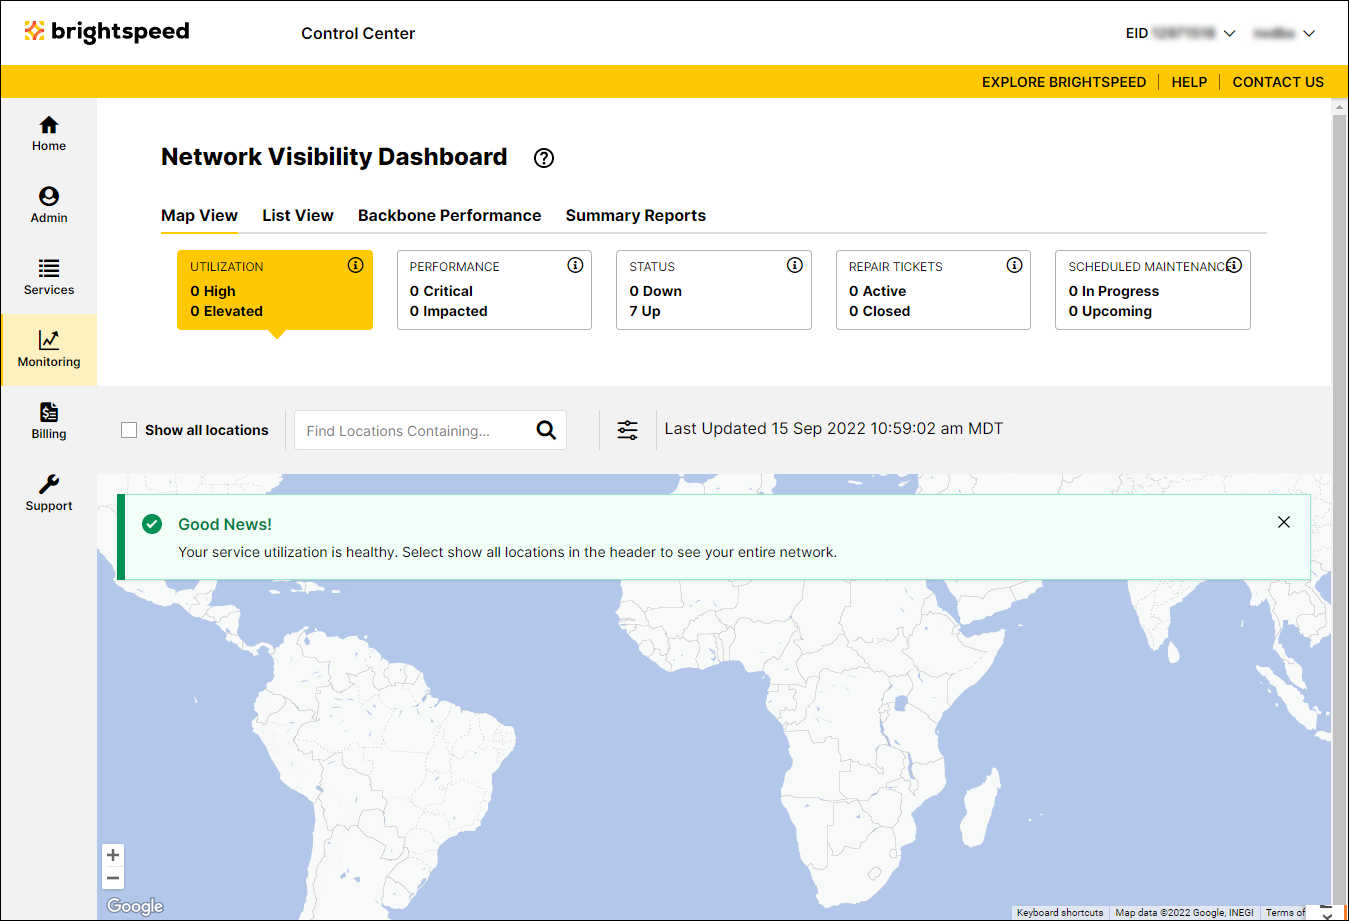
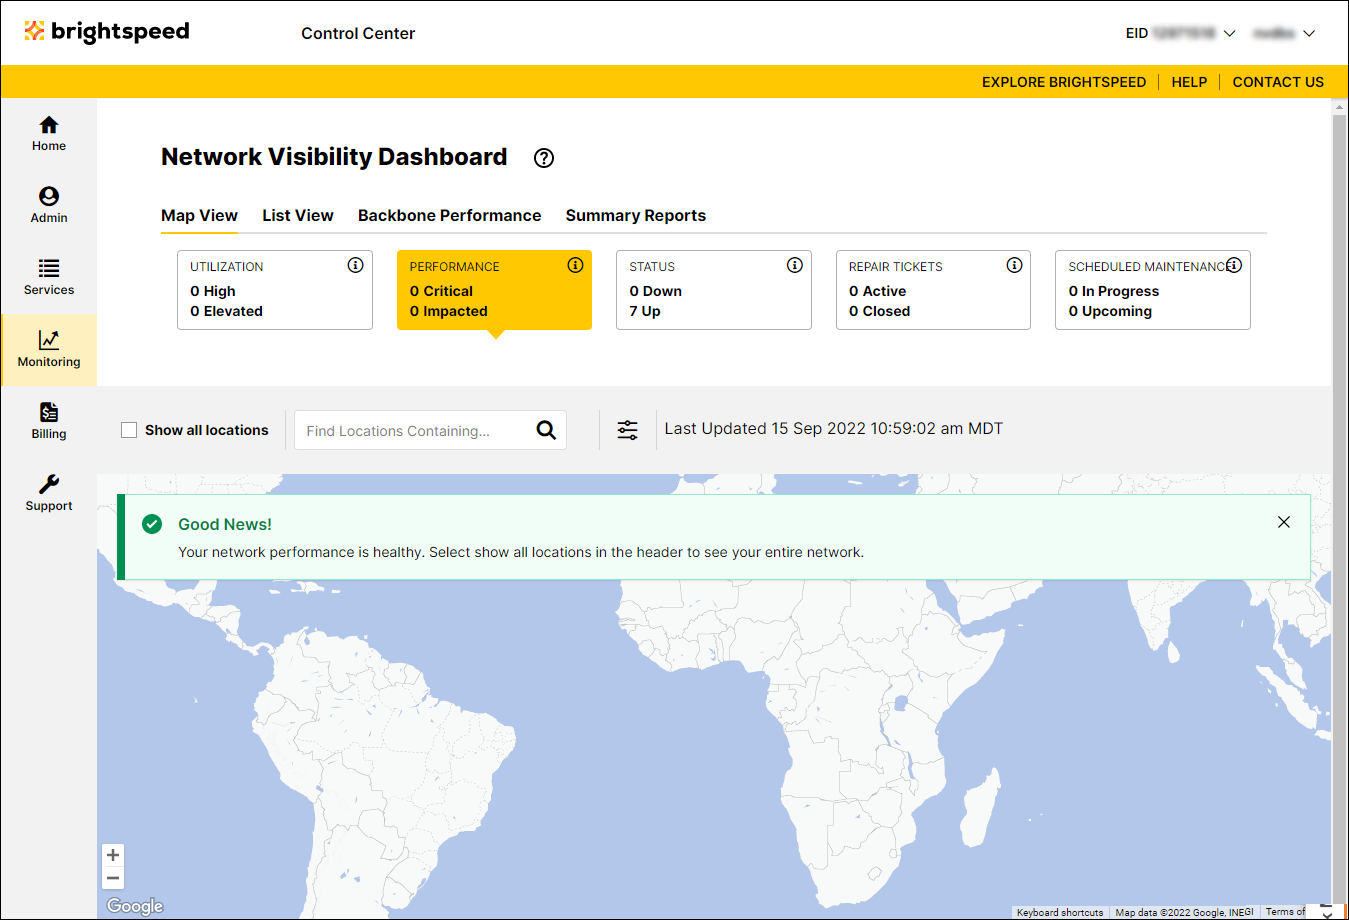
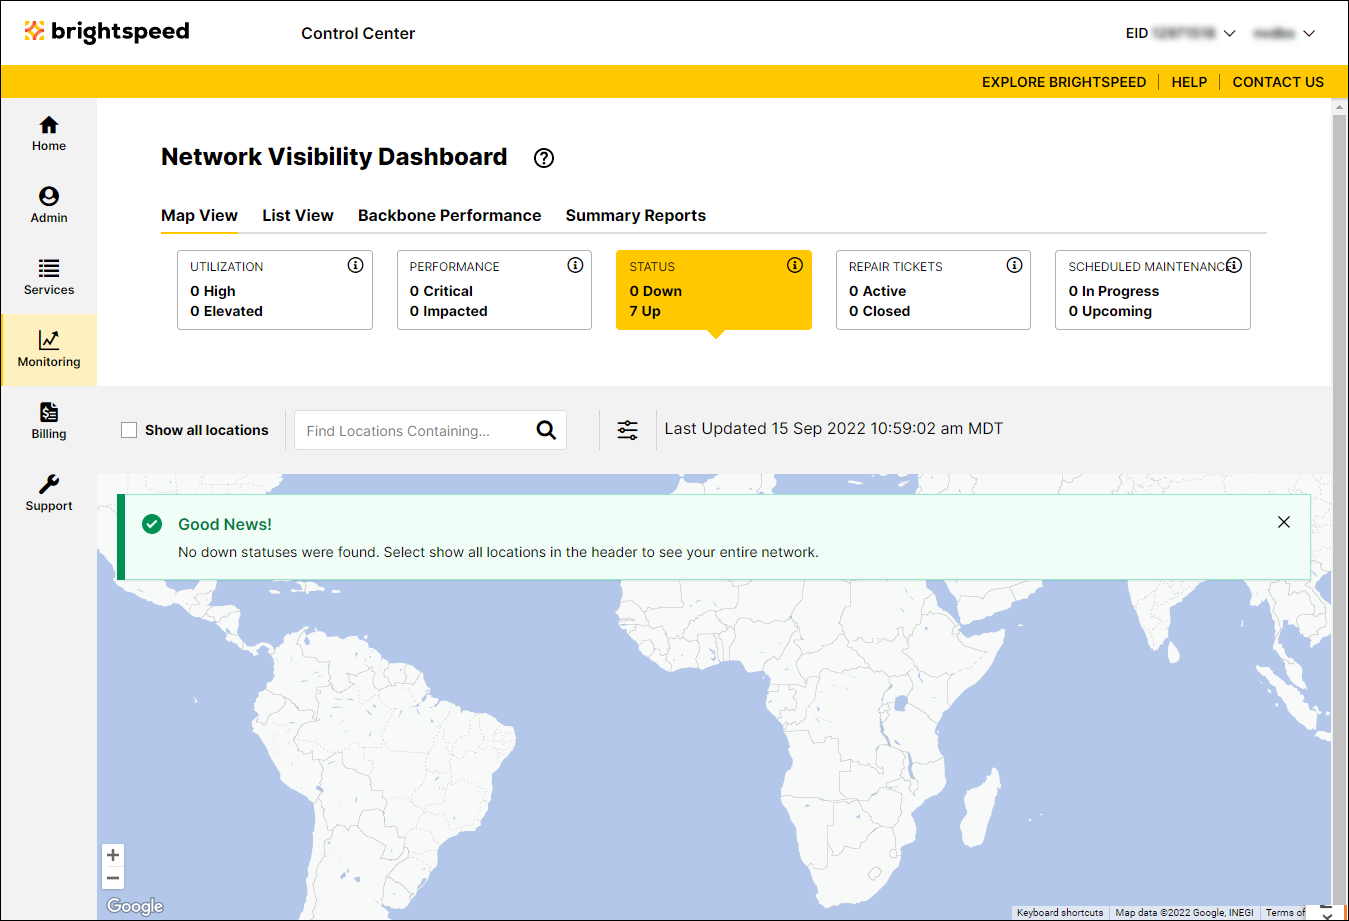
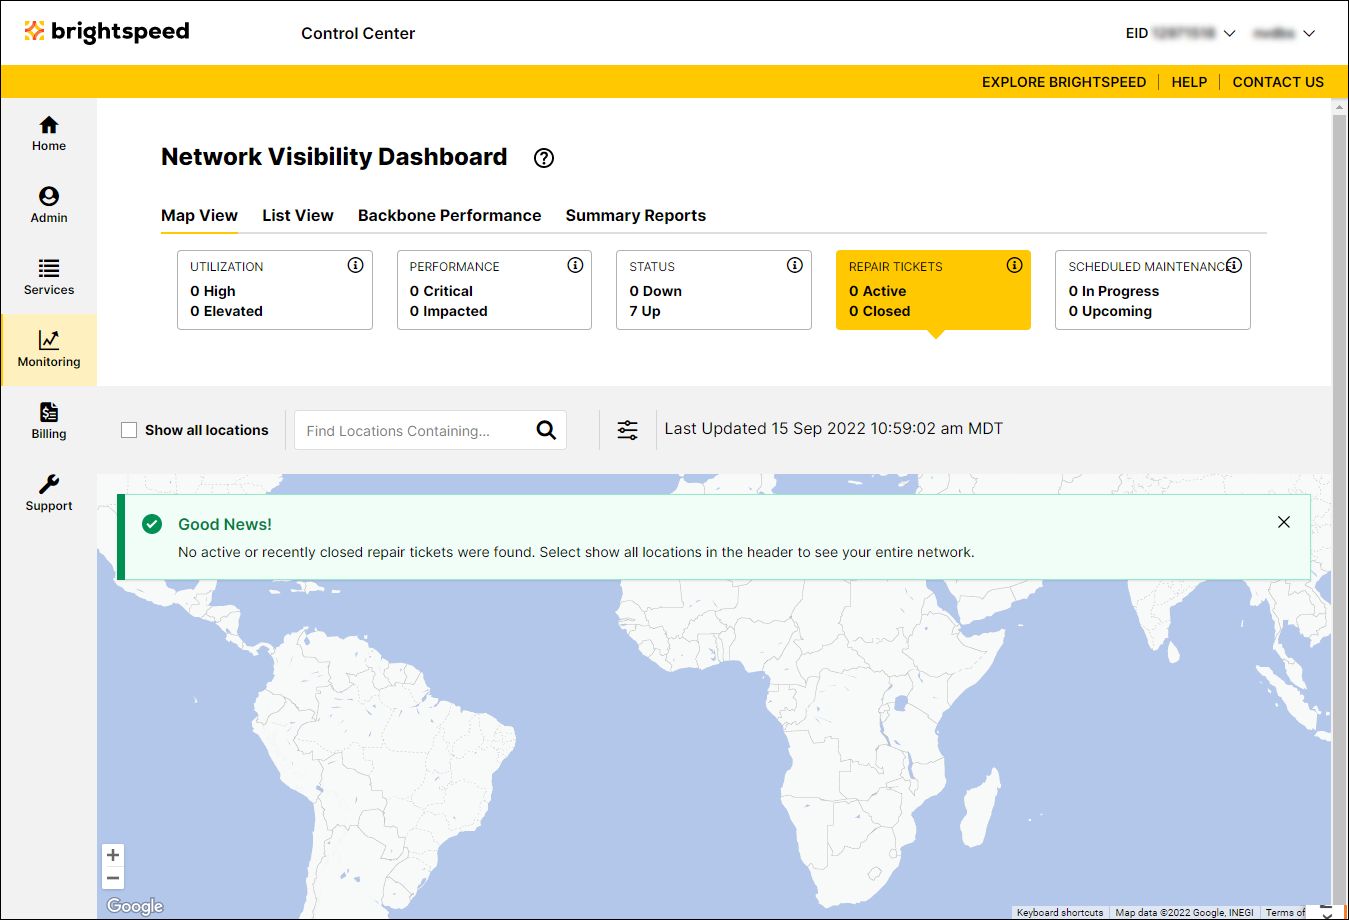
Network Visibility tiles

Network Visibility offers tiles to help you monitor performance, utilization, and issues related to your services. To view more information, click the tile.

To view locations with high or elevated utilization, click the Utilization tile:

  • High: average utilization percentage above 85% during the latest 5-minute sample.

  • Elevated: average utilization above 65% during the latest 5-minute sample.

Utilization data is calculated as follows:

  • bits = bytes * 8
  • bits per second = Bits / time delta (usually 300 for a 5-minute interval)
  • utilization average = bits per second / committed bandwidth
Network Visibility (showing Utilization tab)

To view locations with impacted or critical performance, click the Performance tile:

  • Critical: packet-data delivery less than 95% during the latest 5-minute sample.

  • Impacted: packet-data delivery less than 99% during the latest 5-minute sample.
Network Visibility (showing Performance tab)

To view maps locations that are identified as Down, click the Status tile:

  • Down: Interface Oper status is down during the latest 5-minute sample.

  • Up: Interface Oper status is up during the latest 5-minute sample.
Network Visibility (showing Status tab)

To view locations with open or recently closed tickets, click the Repair Tickets tile.

  • Active: tickets currently open and being worked

  • Closed: tickets recently closed in the past 7 days
Network Visibility (showing Repair Tickets tab)

To view locations with scheduled maintenance currently in progress or upcoming, click the Scheduled Maintenance tile.

  • In Progress: events running now or within the next 24 hours.

  • Upcoming: events scheduled between 24 hours and 30 days from now.
Network Visibility (showing Scheduled Maintenance tab)
Footer logo